See what your software
is doing. Right now.
Logs, live metrics, cron heartbeats, and browser checks in one calm dashboard. No agents to install. Send your first signal with a single HTTP request.
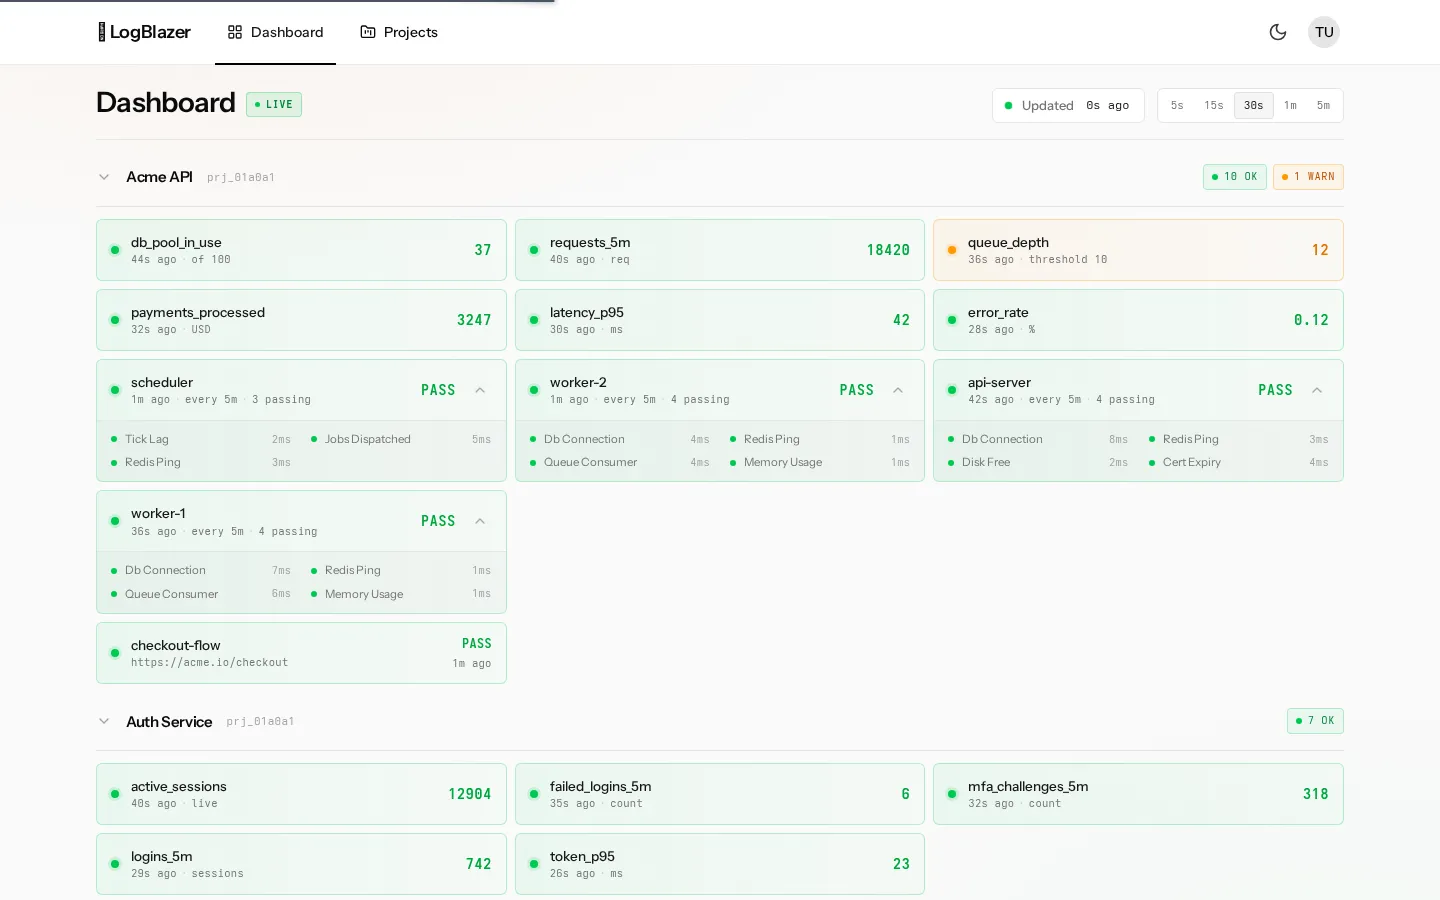
The answer is on one screen.
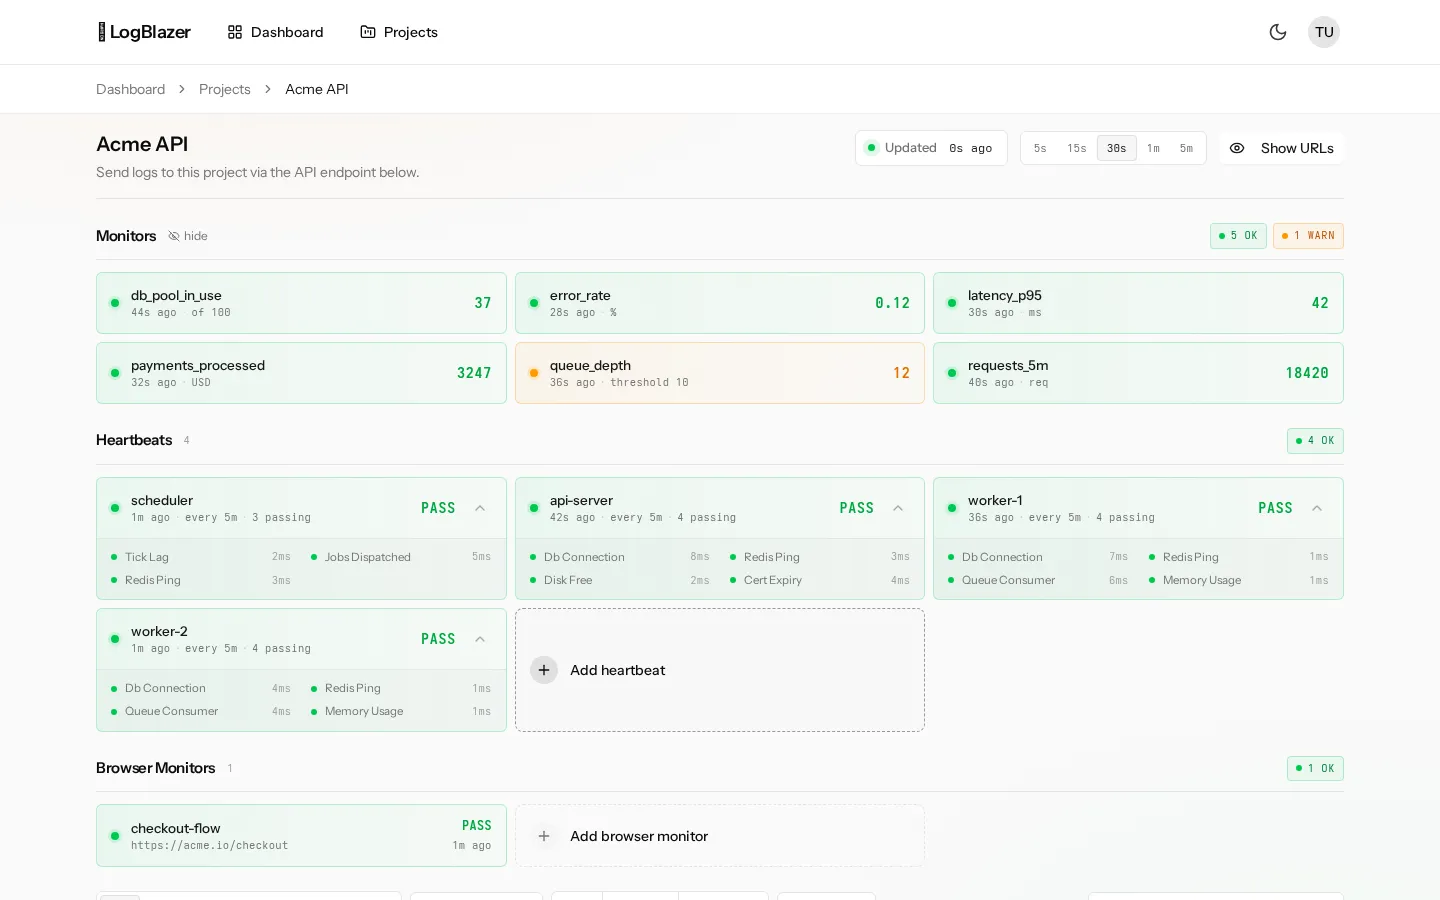
Open a project and see current values, passing heartbeats, browser checks, and recent logs together. Green means good. Amber tells you exactly where to look.
Want a second opinion?
Ask AI about LogBlazer.
Opens with product context and a link to this page.
View or copy the prompt
Four signals. One place to see what's happening.
Stream logs and monitor values, then add heartbeat and browser checks. LogBlazer turns every signal into a useful view — no dashboard builder required.
One endpoint
POST to one URL. Send logs, monitors, or heartbeats — same shape, different kind.
Live monitors
Push a number or a string. It renders as a card that updates in place. Revenue, queue depth, build version — whatever.
Heartbeats
Ping from a cron or a worker. If it stops, you hear about it. If it drifts, you hear about it.
Real-time log tail
Logs stream in under a second. Filter, search, pause — like a terminal you keep open in a tab.
Alerts that aren't noise
Ring on rate, string match, or a silent source. A ping, not a flood.
Browser monitoring
Check the pages your customers use. Catch render failures, console errors, and broken requests before they do.
See all features →·How LogBlazer compares toPapertrail,Healthchecks.ioandBetter Stack
Three plans. Pick one in thirty seconds.
No seat bundling, no "contact sales" for basic stuff, no surprise overage.
- 1 project
- 500k lines / month
- 7 day retention
- Monitors, heartbeats & browser checks
- Unlimited projects
- 10M lines / month per user
- 30 day retention
- Alerts & webhooks
- Unlimited users
- Everything in Team
- 100M lines / month per user
- 90 day retention
- SSO / SAML
- Priority support
First log in under a minute.
Or your next hour, free.
Create a project. Paste one curl. Watch logs stream in. That's the whole onboarding.