Browser monitors
Uptime checks that verify what actually rendered, not just a 200
Browser monitors load a page in a real Chromium browser and decide whether it is healthy by looking at what actually rendered. Register a URL and a set of CSS selectors, and LogBlazer runs the check on a schedule — recording the outcome together with console errors, failed network requests, and a full-page screenshot when the check fails.
The gap
A 200 OK is not proof your page works
Most uptime tools ask your server for a status code and stop there. That catches a machine that fell over. It does not catch the failures that actually reach customers: a JavaScript bundle that 404s, an API call that returns an empty array, a feature flag that ships a blank page, a third-party script that throws before your app mounts. Every one of those serves a cheerful200.
What a status-code check sees
- GET the URL.
- Status is 200.
- Report healthy. Go back to sleep.
Meanwhile the page renders an empty div and a console full of red.
What a browser monitor sees
- Load the page in real Chromium.
- Poll the rendered DOM for your selectors.
- Nothing matched inside the render budget — record FAIL with the console errors, the failed requests, and a screenshot.
The alert arrives with the evidence already attached.
Want a second opinion?
Ask AI about LogBlazer.
Opens with product context and a link to this page.
View or copy the prompt
Assertions
You define health with CSS selectors
A browser check does not decide health from the HTTP status alone. Once the page has loaded, LogBlazer polls the rendered DOM — every frame on the page, not just the top document — until one of your selectors matches a visible element or the render budget runs out.
Pass selectors
Evidence the page rendered what it should — the pricing table, the logged-in nav, the search results. The first pass selector to become visible ends the check asPASS. At least one is required: a monitor with no pass selector could never report a pass, so the API rejects it with a 422.
Fail selectors
Evidence something went wrong — an error banner, a stack trace, a maintenance notice. Fail selectors are optional, and they are checked before pass selectors on every poll, so a visible fail selector ends the check asFAIL even when a pass selector is also on the page.
Order of evaluation for one check
- A page that fails to load is a
FAIL. - An HTTP status outside 200–299 is a
FAIL, recorded without evaluating any selector. - Otherwise LogBlazer polls fail selectors then pass selectors, roughly ten times a second, until
render_timeout_secondselapses. - Nothing matching by then is a
FAILwith reasonrender_timeout— a distinct signal from a server that never answered.
Register one with a POST
curl -X POST https://app.logblazer.com/api/browser-monitors/YOUR_API_KEY \
  -H "Content-Type: application/json" \
  -d '{
    "name": "Checkout renders",
    "url": "https://example.com/checkout",
    "pass_selectors": ["#order-summary", "[data-testid=pay-button]"],
    "fail_selectors": [".error-banner", "#maintenance"],
    "render_timeout_seconds": 12
  }'
Full field reference, response shapes and error codes are in theAPI documentation.
On the dashboard
The failure and the logs, on one screen
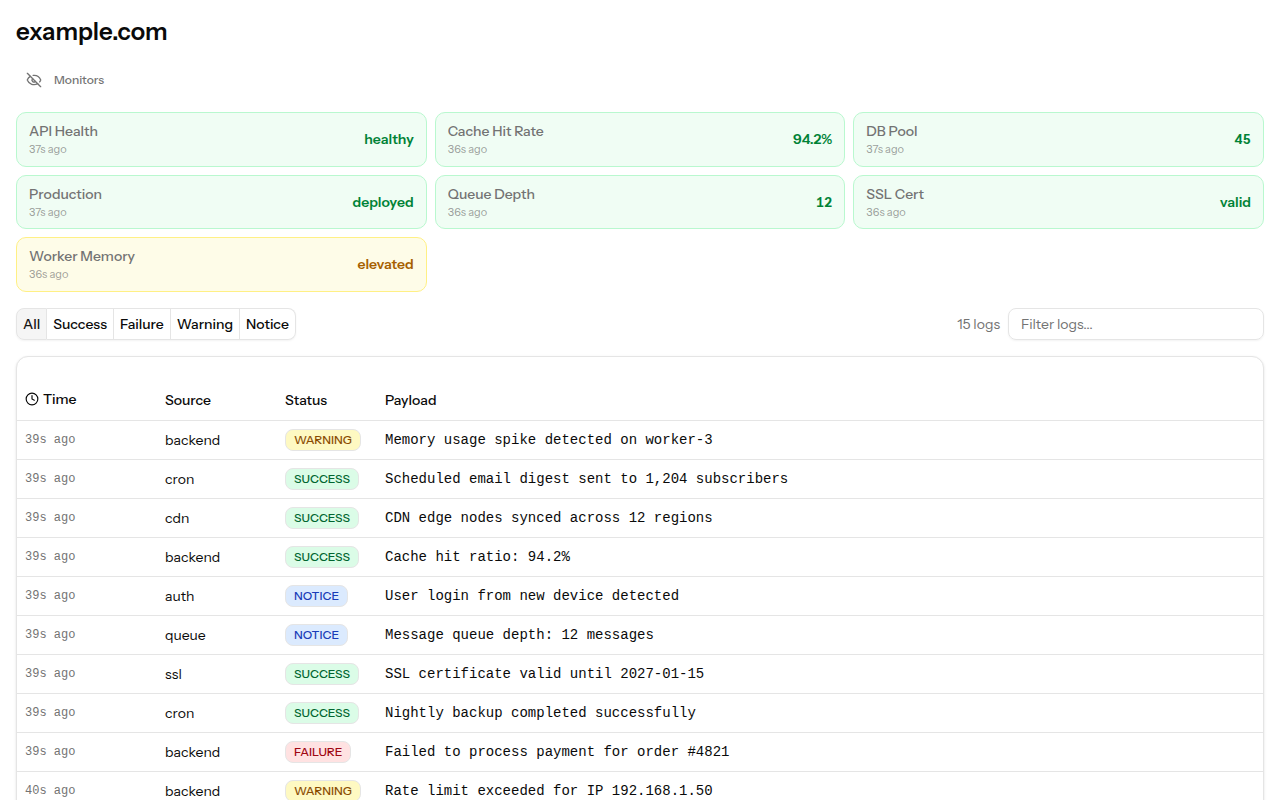
Browser monitor results are integrated into your project dashboard as monitor cards and log entries automatically. When a check fails you get the console errors and failed network requests captured during that load, a full-page screenshot from the moment it failed, and — because it is the same project — your server-side logs from the same minute, without opening a second tool. Repeated failures are emailed to you.
FAQ
Browser monitoring questions
How is a browser monitor different from a normal uptime check?
A normal uptime check asks the server for a status code. A browser monitor loads the page in a real Chromium browser, waits for it to render, and then decides health by looking for elements you name with CSS selectors. A page that returns 200 while rendering an empty shell, a JavaScript error, or a maintenance banner passes the first check and fails the second.
What are pass and fail selectors?
Pass selectors are evidence the page rendered what it should — the pricing table, the logged-in nav, the search results. The first pass selector to become visible ends the check as PASS, and at least one is required. Fail selectors are evidence something went wrong — an error banner, a stack trace, a maintenance notice. They are optional, and they are evaluated before pass selectors on every poll, so a visible fail selector ends the check as FAIL even when a pass selector is also on the page.
What happens when a check fails?
LogBlazer records the outcome alongside any console errors and failed network requests from the page load, plus a full-page screenshot taken at the moment of failure. All of it lands in the same project dashboard as your logs and monitor cards, and repeated failures are emailed to you.
How long will it wait for a slow page?
You set render_timeout_seconds per monitor. LogBlazer polls the rendered DOM roughly ten times a second until a selector matches or that budget runs out. Nothing matching by then is recorded as a FAIL with reason render_timeout, which is a genuinely different signal from a server that never answered.
Does it check inside iframes?
Yes. Selector polling covers every frame on the page, not just the top document — so a checkout widget or an embedded dashboard rendered in an iframe can be the thing you assert on.
Do I need browser monitors if I already have heartbeats?
They answer different questions. Heartbeat monitors confirm a backend job or service is alive and responding on schedule. Browser monitors confirm the page a customer actually opens rendered correctly. Teams commonly run both, and both appear on the same dashboard as your logs.
Point a browser monitor at your checkout page
Free forever plan, no credit card. First check running in under 60 seconds.