Features
A log dashboard with monitor cards and heartbeat checks built in
LogBlazer is a simple but powerful logging dashboard. Send logs from any language, organize them by source and status level, create monitor cards for at-a-glance health checks, watch cron jobs and workers with heartbeats, verify what your pages actually rendered with browser monitors, and share public dashboards with your team — all without the complexity of traditional observability platforms, and all through the same HTTP endpoint.
Log viewer
Real-time log dashboard
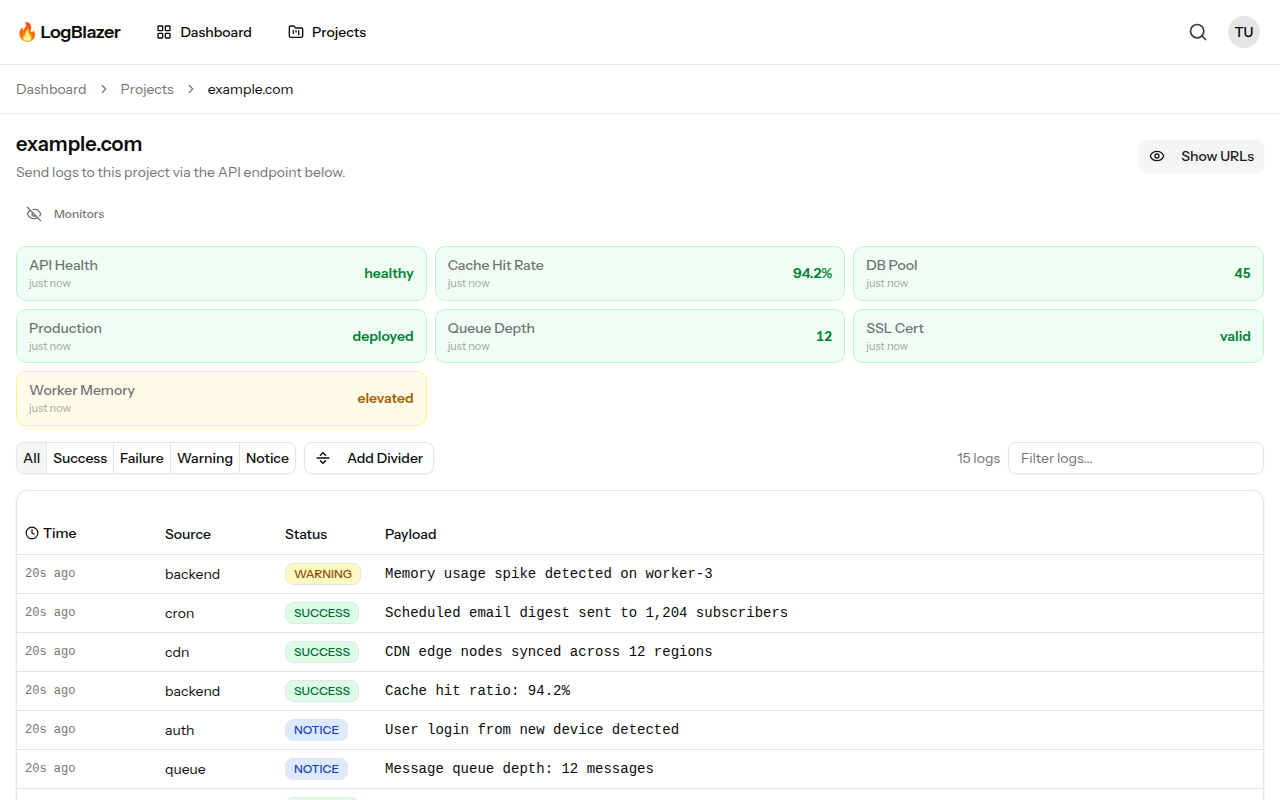
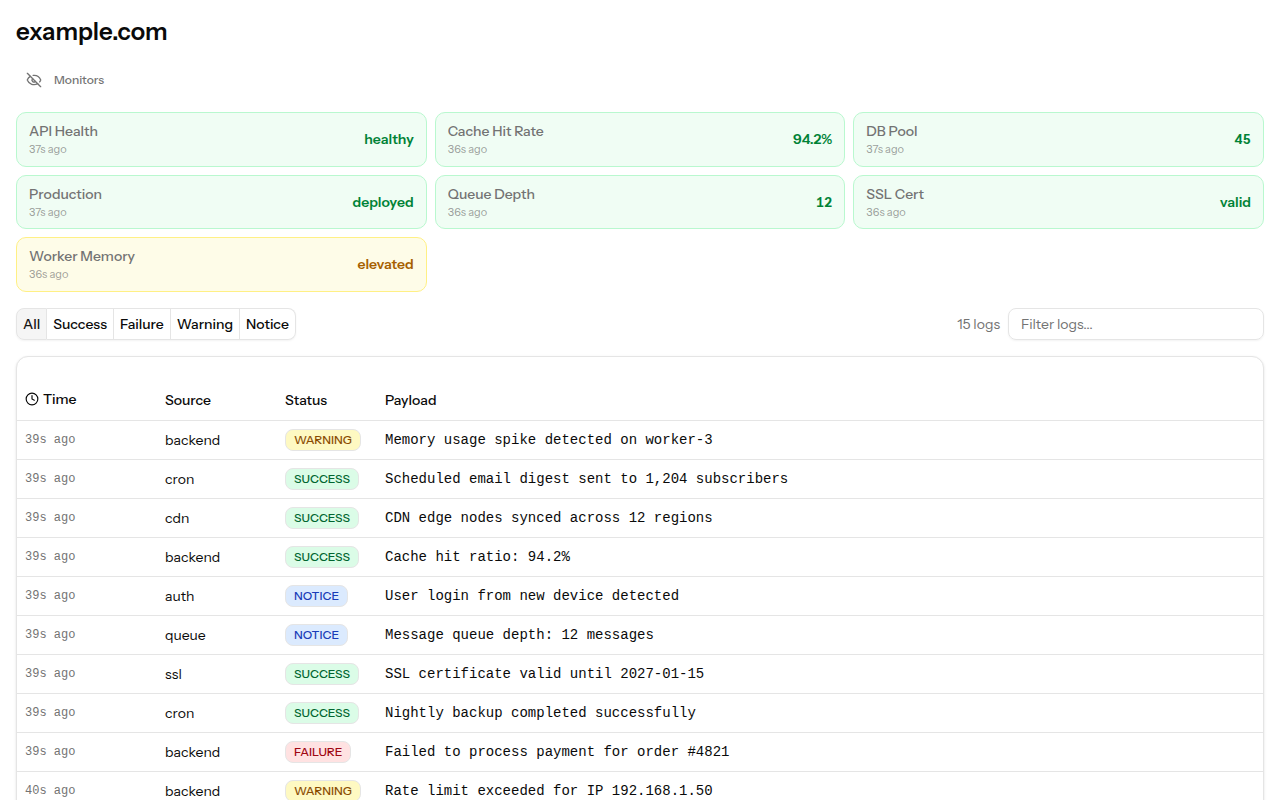
Logs flow into your dashboard in real time, organized by source. Each entry is color-coded by status level — SUCCESS, FAILURE,WARNING and NOTICE — so you can spot problems at a glance without reading a single line in full. Monitor cards sit at the top of the page, giving you a live overview of the metrics that matter most above the stream they came from.
Entries appear in under a second, which makes the dashboard usable as a working tail rather than an archive you consult after the fact: deploy, watch, and see the first request hit. Retention runs 7 days on the free Hobby plan, 30 days on Team and 90 days on Pro, and nothing is sampled away in between — what you sent is what you can read back.
Monitors
Monitor cards at a glance
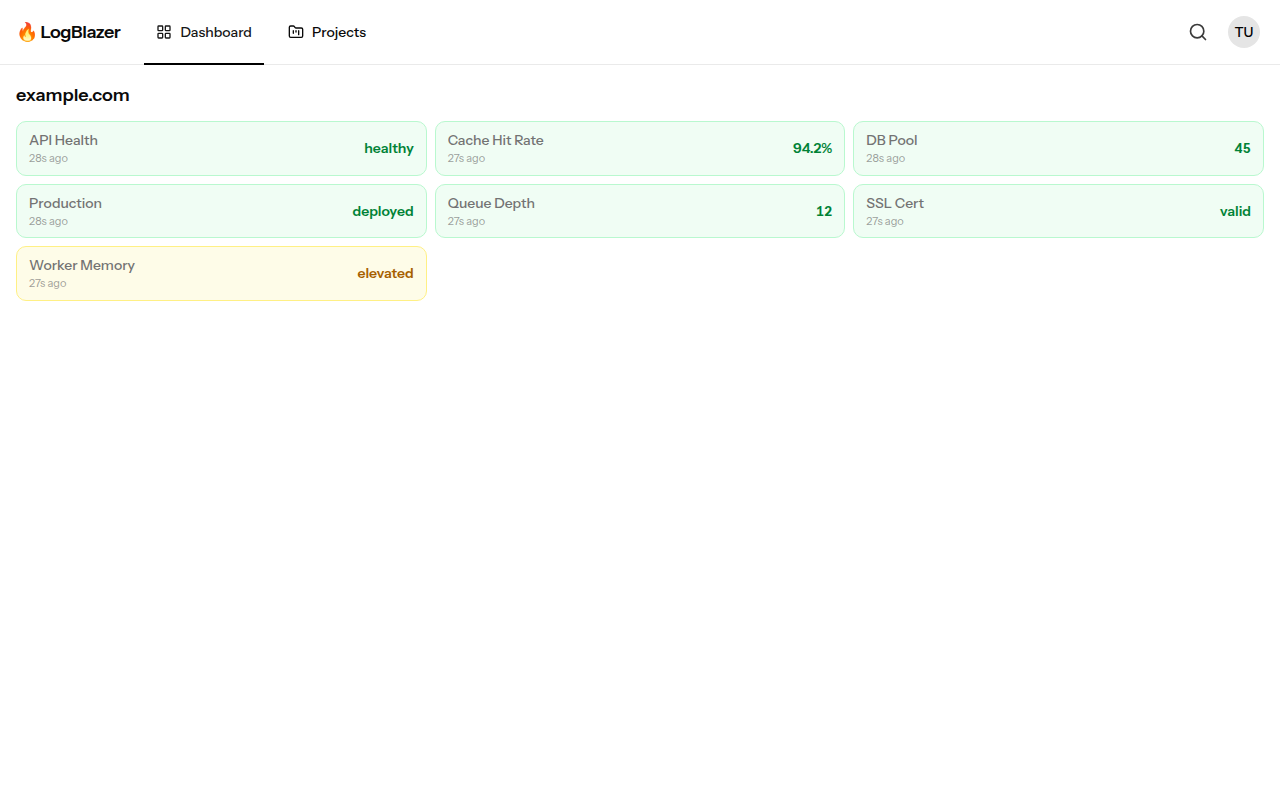
Create custom monitors — status, boolean, number, or text — that appear as color-coded cards on your dashboard. Track deployment status, API health, queue depth, cache hit rates, MRR, signups, and anything else you can measure. Each card updates in place with the latest value you send, so the dashboard always shows now rather than a rolling history you have to interpret.
A monitor is not a separate product with its own SDK: it is the same POST you already make to ship a log line, with monitor_title,monitor_type and monitor_value attached. That means the number and the log line explaining the number arrive together, from the same code path, and land on the same screen. Status colours follow the same four levels as logs, so a red card and a red log entry mean the same thing.
Heartbeats
Heartbeat checks for cron jobs and workers
Heartbeats let LogBlazer actively monitor your services. Register a URL and LogBlazer will ping it on a configurable schedule — anywhere from every minute to every hour — parse a standardised JSON health response, and alert you by email when checks fail. Results are integrated into your project dashboard as monitor cards and log entries automatically, so a failing check is visible in the same place as the output that explains it.
The reverse model works too: a cron job can POST a ping when it finishes, and LogBlazer alerts you when the ping does not arrive inside its window. Because a ping is one HTTP request, the same crontab line that runs the job can send it — and carry the job's output as the payload. Nightly batch jobs, queue workers, webhook consumers and backup scripts all fit the same shape.
Browser monitors
Browser monitors that check what actually rendered
Browser monitors load a page in a real Chromium browser and decide whether it is healthy by looking at what actually rendered. Register a URL and a set of CSS selectors and LogBlazer will run the check on a schedule, recording the outcome together with console errors, failed network requests, and a full-page screenshot when the check fails.
Pass selectors are evidence the page rendered what it should — the pricing table, the logged-in nav, the search results. Fail selectors are evidence something went wrong — an error banner, a stack trace, a maintenance notice — and they are checked first on every poll. This catches the failures a status-code check cannot see: a 200 response that renders an empty shell because a bundle 404'd or a third-party script threw before your app mounted.
Search
Search and filter instantly
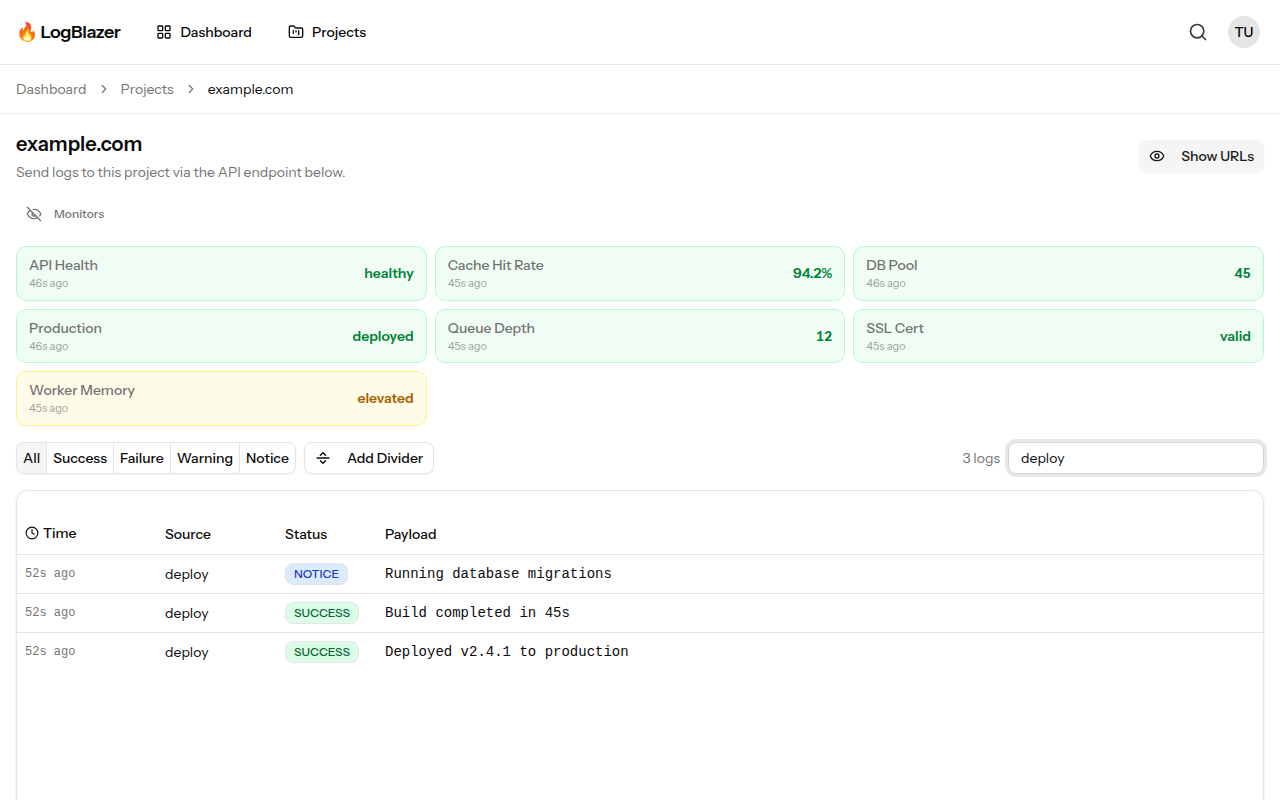
Full-text search across all your logs, with filters for source and status level that compose with the query rather than replacing it. Find exactly what you need in seconds, no matter how many entries you have — and without learning a query language first. Search "deploy", narrow toFAILURE, and read what happened.
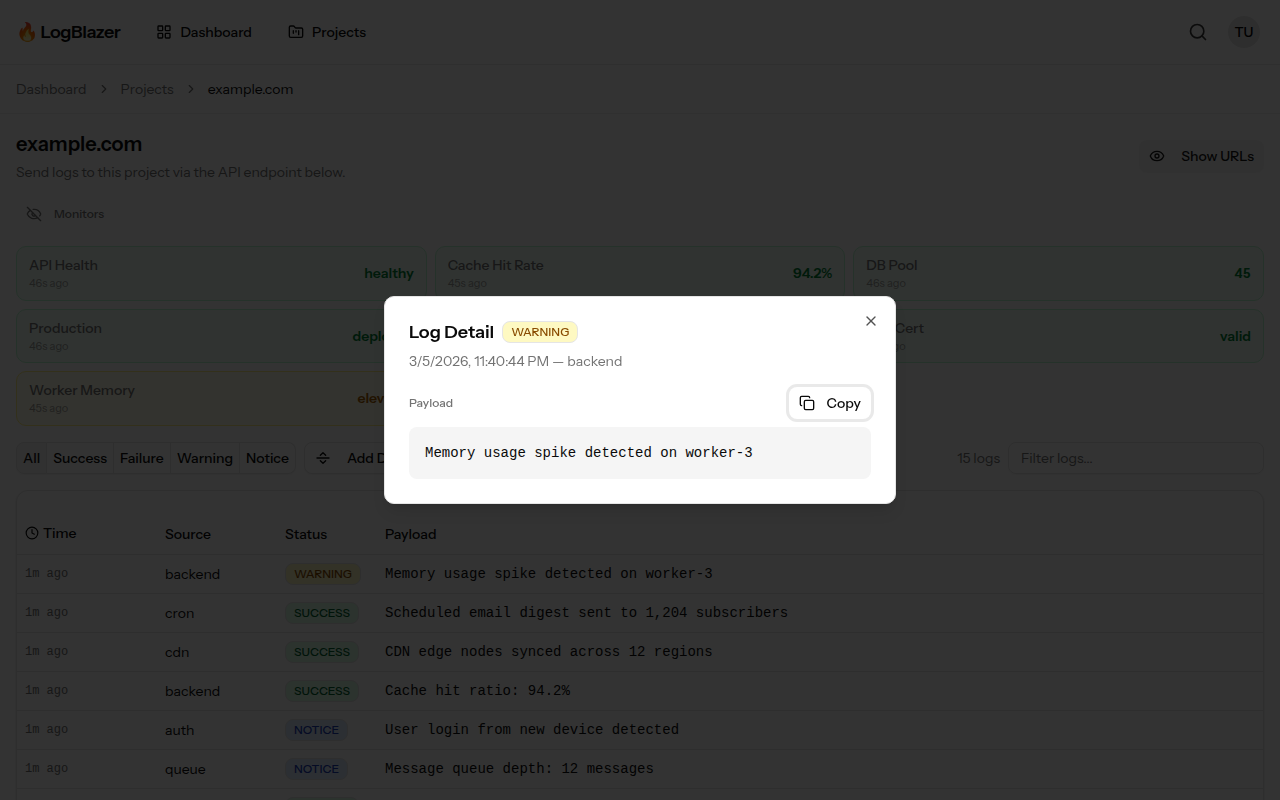
Every entry opens to a detail view with the full payload, the source, the status level and the exact timestamp, so a truncated line in the stream is never the end of the trail. There are no per-job or per-source caps on what is searchable: the whole retention window is in scope.
Alerts
Alerts that aren't noise
Alerting rings on the things that actually indicate a problem: an error rate crossing a threshold, a string match in a payload, a monitor leaving its expected range, or a source going silent when it should be chatty. A ping, not a flood — and repeated failures are grouped rather than re-sent for every occurrence.
Silence is treated as a signal in its own right. A source that stops sending is usually more interesting than one sending errors, because errors mean the code is still running. Alerts and webhooks are included from the Team plan up, with no per-alert or per-destination metering.
Projects
Environments, built in
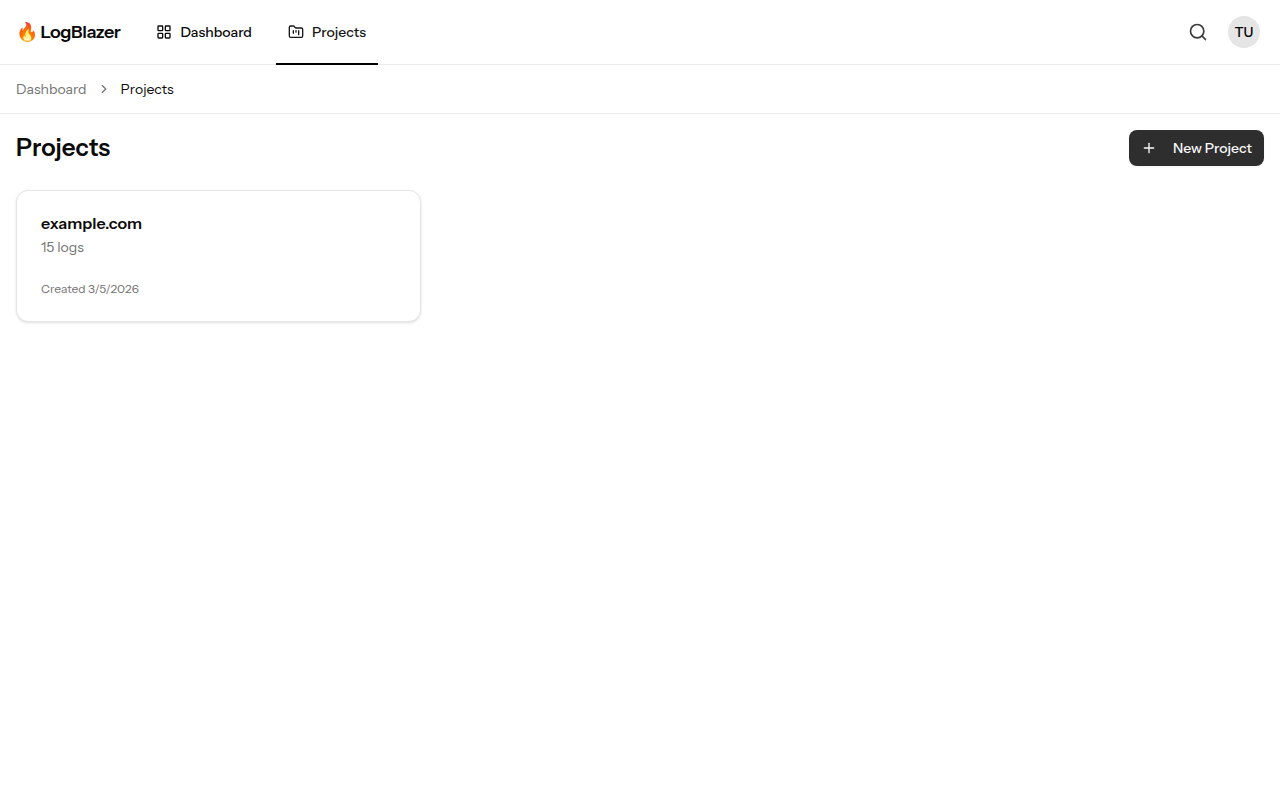
dev, staging and prod without three accounts and three invoices — the environment is a tag on the key. Each project has its own API key, its own dashboard and its own public URL, and the project list gives you every one of them with current status at a glance.
Because the key carries the routing, promoting code between environments needs no code change: swap the key in your config and the same POST lands in the right project. The free Hobby plan covers one project; Team and Pro are unlimited.
Sharing
Share a public dashboard
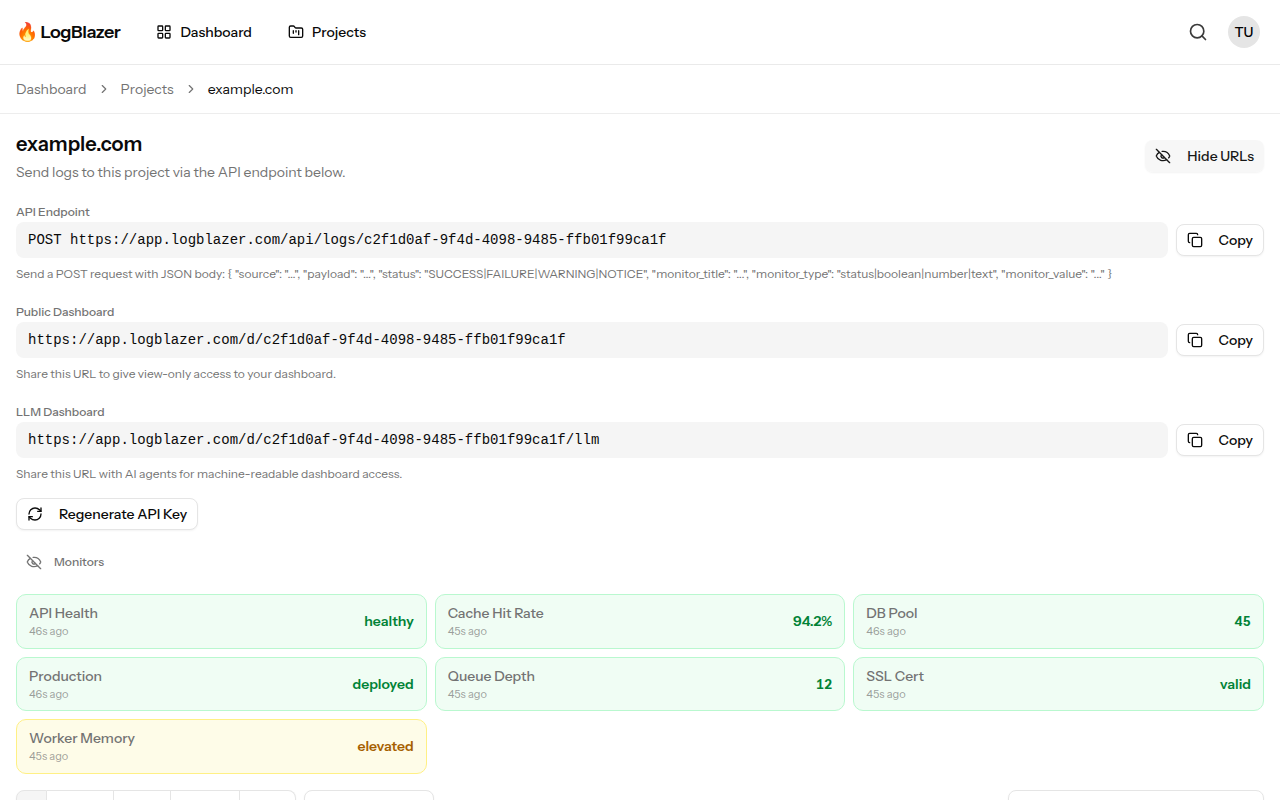
Every project gets a shareable public URL. Give stakeholders, clients, or your team read-only access to monitors and logs without creating accounts. One link, no login required, nothing to provision — which is the difference between a status update someone actually looks at and one they ask you for.
The public view shows the same monitor cards and log stream as the private one, so there is no second dashboard to build and keep in sync. It is the same data, with write access removed.
AI integration
Built for AI agents
Every dashboard has an LLM-friendly endpoint that returns clean, structured Markdown. Let AI agents monitor your infrastructure, parse logs, and take action — all from a single URL. Append /llm to any public dashboard URL and get data that machines can read: a monitors table and recent log entries as text/plain, with no authentication and no HTML to scrape through.
That makes it a one-line tool definition for an agent, a one-line curlin a runbook, and something you can paste straight into a chat when you want a second opinion on what your logs are saying.
API
One endpoint. Any language.
Send a single POST request and your log appears on the dashboard. No SDKs to install, no agents to run, no configuration files to manage, no ports to open. If your language can make an HTTP request, it works with LogBlazer — and the same endpoint carries logs, monitor values and heartbeats, so there is one integration to write rather than three.
curl -X POST https://app.logblazer.com/api/logs/YOUR_API_KEY \
  -H "Content-Type: application/json" \
  -d '{"source": "deploy", "payload": "Deployed v2.4.1", "status": "SUCCESS"}'
Full API reference — logs, heartbeats and browser monitors →
Ready to start?
Free forever plan, no credit card required. First log in under 60 seconds.